Symptoms
-
Plesk login is slow or impossible: a white page is shown instead.
-
Plesk interface and websites are working slow. For example, opening the menus Domains > example.com > File Manager or Plesk > Subscriptions takes significant time.
-
Restoration of a Plesk-made backup (specifically, the execution of the utility
/usr/lib64/plesk-9.0/sw-tar) can take a lot of time. -
With the Plesk debug mode enabled, the commands logged to the log file
/var/log/plesk/panel.logshow that IO operations take a long time to complete:Example of a slow server:
DEBUG [util_exec] [8053637617e48c1bb69e7a15225a3d18-0] Starting: filemng root file_exists /root/.autoinstaller/microupdates.xml --allow-root, stdin:
DEBUG [util_exec] [8053637617e48c1bb69e7a15225a3d18-0] Finished in 8.4113s, Error code: 0, stdout: 0
, stderr:
DEBUG [util_exec] [5b2bb52605a53] Starting: filemng root cat /root/.autoinstaller/microupdates.xml --allow-root, stdin:
DEBUG [util_exec] [5b2bb52605a53] Finished in 16.7445s, Error code: TRUE, stdout: , stderr:Example of normal environment:
DEBUG [util_exec] [a05daf3428f1f60f55e3b94e5bfc4cb6-0] Starting: filemng root file_exists /root/.autoinstaller/microupdates.xml --allow-root, stdin:
[2018-06-21 21:23:54.472] DEBUG [util_exec] [a05daf3428f1f60f55e3b94e5bfc4cb6-0] Finished in 0.01272s, Error code: 0, stdout: 0
, stderr:
DEBUG [util_exec] [5b2bb4fa73614] Starting: filemng root cat /root/.autoinstaller/microupdates.xml --allow-root, stdin:
[2018-06-21 21:23:54.486] DEBUG [util_exec] [5b2bb4fa73614] Finished in 0.01314s, Error code: TRUE, stdout: , stderr: -
Disk write speed is very low:
-
Streaming I/O
Example of a slow server:
# dd if=/dev/zero of=/root/testfile bs=512 count=5000 oflag=direct
3563+0 records in
3563+0 records out
1824256 bytes (1.8 MB) copied, 673.815 s, 2.7 kB/sExample of normal environment:
# dd if=/dev/zero of=/root/testfile bs=512 count=5000 oflag=direct
5000+0 records in
5000+0 records out
2560000 bytes (2.6 MB) copied, 0.0180294 s, 142 MB/s -
Latency
Example of a slow server:
# dd if=/dev/zero of=/root/testfile bs=1024M count=1 oflag=direct
1+0 records in
1+0 records out
1073741824 bytes (1.1 GB) copied, 52.631 s, 20.4 MB/sExample of normal environment:
# dd if=/dev/zero of=/root/testfile bs=1024M count=1 oflag=direct
1+0 records in
1+0 records out
1073741824 bytes (1.1 GB) copied, 1.75607 s, 611 MB/s<
-
-
When running the utility
top, high %wa percentage is displayed (CPU waiting for the IO resources):# top - 10:52:54 up 3:41, 7 users, load average: 105.98, 102.68, 107.96
Tasks: 466 total, 19 running, 446 sleeping, 1 stopped, 0 zombie
%Cpu(s): 8.5 us, 8.5 sy, 0.0 ni, 0.1 id, 82.8 wa, 0.0 hi, 0.1 si, 0.0 st -
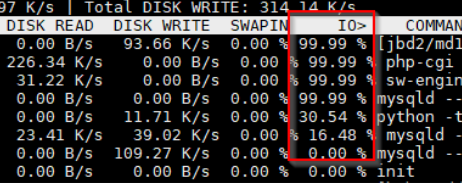
When running the utility
iotop, multiple processes are running with 99.99% IO:
Cause
The hard disk performance is unable to maintain the IO load.
Resolution
-
Check the processes are run on the server and stop unneeded processes.
-
Contact the service provider to troubleshoot the IO performance and modify the disk subsystem to provide better IO.
Note: Amazon AWS and Lightsail instances may throttle the IO performance: I/O Credits and Burst Performance
