Monitoring


Version
2.10.3
Requires
18.0.53
Developer
Plesk
Category
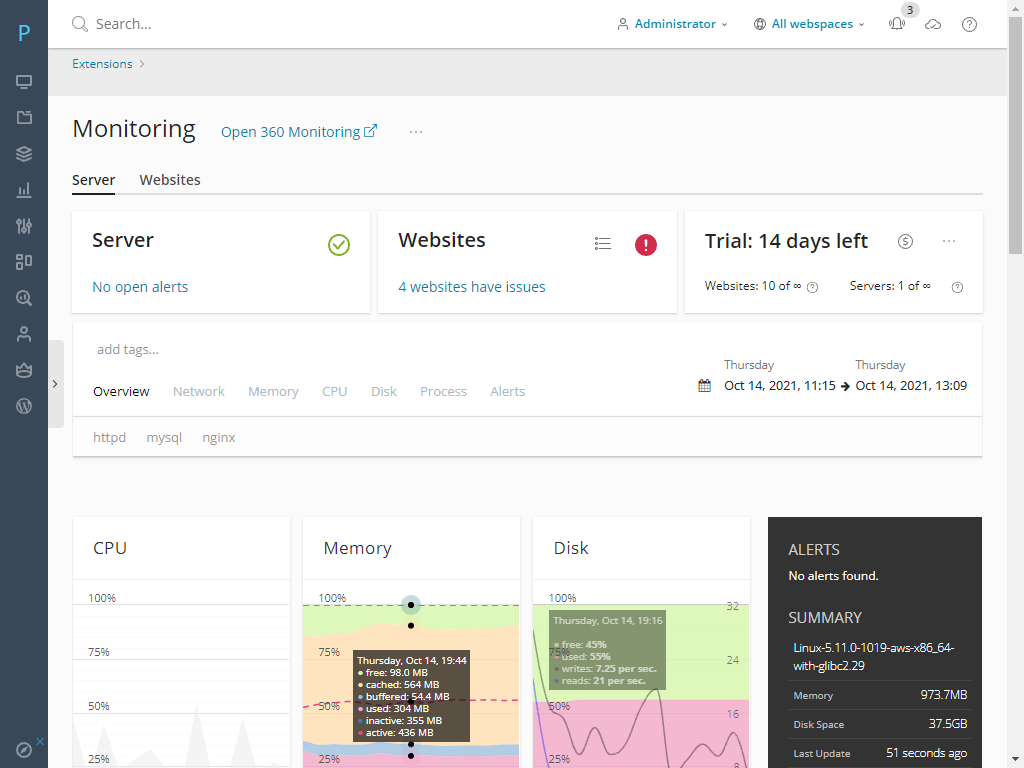
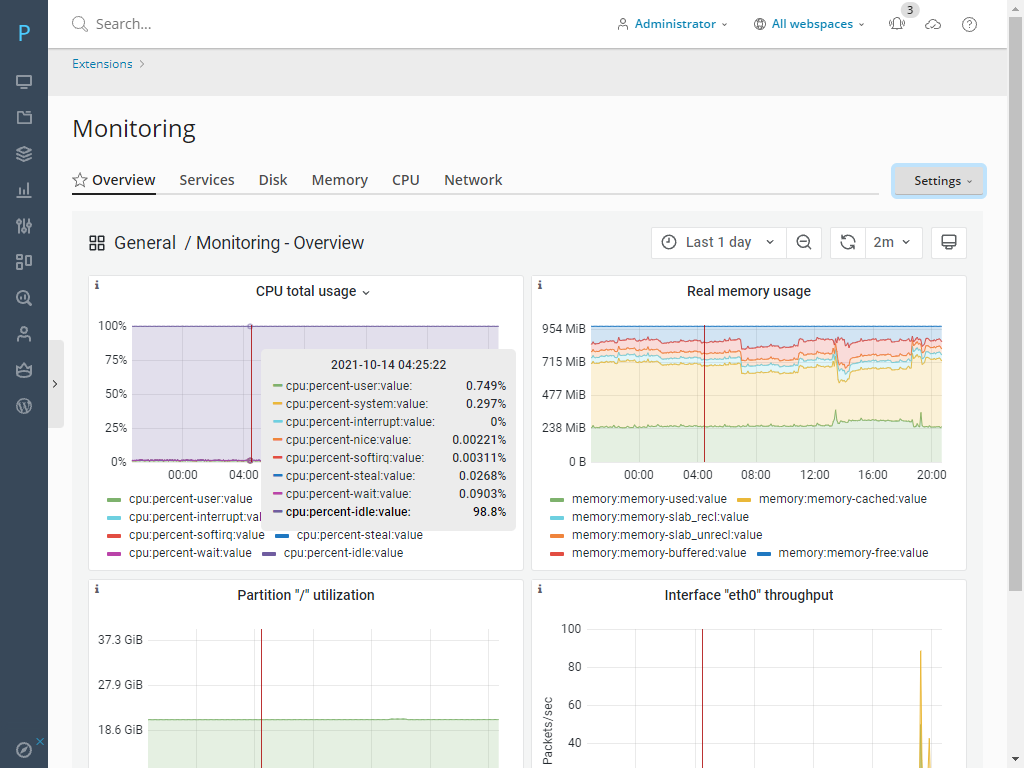
Monitoring (former Advanced Monitoring) is the extension that monitors your server metrics and displays them as visually appealing graphs.
Monitoring has two modes:
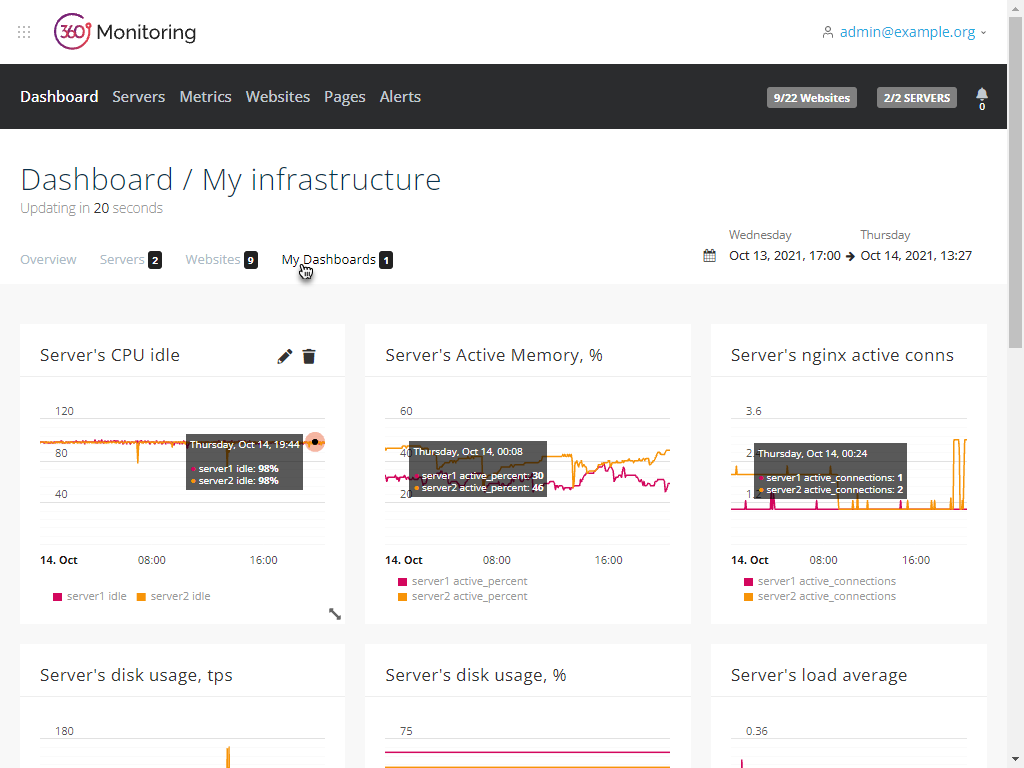
- Integration with 360 Monitoring, a new feature delivered by the cloud service Plesk 360.
- Built-in Monitoring that works in tandem with the Grafana extension.
Note: 360 Monitoring works in Plesk Obsidian 18.0.36 and later.
Regardless of the mode you choose, you can do the following:
- See detailed reports on the server health.
- See how server health parameters change with time.
- Change the displayed time period.
- Keep track of the server system resource usage.
- Configure email notifications to inform when one or more resource usage reaches the predefined threshold.
Integration with 360 Monitoring, however, brings even more to the table, namely:
- Website availability monitoring.
- Monitoring of multiple servers.
- Various notification channels.
