Question
What to do if I receive a notification from Advanced Monitoring about critical memory usage:
The memory usage status is critical!
The current value is X.X GiB.
Answer
The notification informs the Plesk administrator that the memory consumption by some services or processes on the server exceeds the threshold values configured in Advanced Monitoring > Settings > Thresholds.
There are two possible situations for this to appear:
- The memory usage is expected but the threshold is set too low.
- The memory usage is unexpected and requires additional investigation.
How to investigate:
-
Get the current memory usage threshold values for alerts at Advanced Monitoring > Settings > Thresholds.
-
Estimate the current memory usage:
For Linux:
-
Use the command
free -mhto see the general overview of the memory used on the server. If there is the valueavailableconsider it as the main parameter showing free memory available on the server, otherwise refer to the valuefree.Note: This 3rd-party topic has a good explanation how to read memory parameters in Linux OSes: https://www.linuxatemyram.com/
-
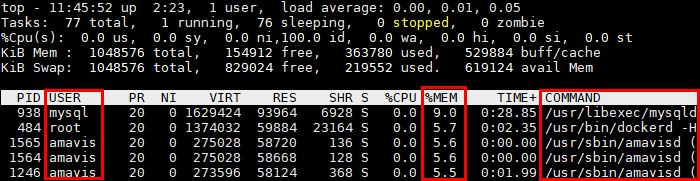
Use the utility
topwith the key-oand the value%MEMwhen connected to the server via SSH to see the constantly refreshing list of all the processes sorted by the memory usage. -
Add key
-cto the command to see the extended command line parameters for the list of processes which is very useful. -
Take a look at the column
%MEMto find the processes that consume the most memory resources. -
The columns
USERandCOMMANDwill help to understand what the process is and who runs it.
# free -mh

# top -o %MEM -c
Additionally you may use
atoputility to monitor memory usage. It allows to review memory usage with historical data later in case that the memory usage gets high and notification triggered on times when online monitoring is not possible. This article can be used Monitor usage of system resources.For Windows:
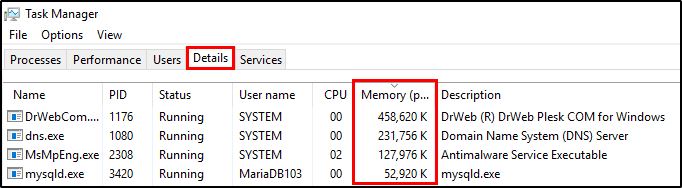
- Use Windows Task Manager Ctrl + Shift + Esc when connected to the server via RDP.
- On a Processes tab click on the Memory column to sort the processes by the memory usage.
- For more details about the process use Details tab which also can be sorted by memory usage.
-
-
Use the gathered data for further analysis:
-
If the memory usage is expected define the optimal values that are above average and are not considered to be critical. Adjust thresholds at Advanced Monitoring > Settings > Thresholds
-
If the memory usage is expected but it causes server performance issues consider increasing the server memory resources, for example, by adding more RAM.
-
If the memory usage is unexpected perform your own investigation to find the cause of the high memory usage by particular processes. Refer to the open sources for suggestions. Check for articles with known issues and solutions in our Knowledge Base
-


